
· By Stéphane Nouhaud
The memory trap of the Qlik Sense & Qlik Cloud table
“We just want a table with all the rows, so we can browse through it.” The request comes up in almost every Qlik project. It looks harmless: users only look at twenty or so rows at a time. Yet on 10 million rows, we measured a peak of 3.9 GB of RAM for a single opening of the table. The reason lies in how the engine works, which is the same in Qlik Sense Enterprise on Windows and in Qlik Cloud: a Qlik table is not a browsing table. This article explains what happens, then details two workarounds: the classic solution, which asks users to filter, and manual paging for cases where you cannot require it.
Throughout this article, “table” means the Qlik Table visualization object (Straight Table) placed on a sheet, not a table of the data model.
A Qlik table is not a browsing grid
A business application grid or an SQL client queries the database page by page: LIMIT 100 OFFSET 200 only reads the requested rows. The Qlik table works differently. It displays the result of a hypercube, and the associative engine computes it in full before showing a single row:
- the engine determines every combination of dimensions possible in the current selection;
- it computes each measure for each of these rows, then sorts the whole set;
- it keeps the result in its result cache;
- the client only fetches the visible rows, as the user scrolls or turns pages.
Paging or scrolling in the table only acts on step 4. They lighten the network and the browser, not the engine: to display 100 rows out of 10 million, the engine has computed, sorted and cached 10 million.
The cache adds to the bill. It is shared between users, which is a good thing for dashboards: a chart already computed for a selection state is served immediately to the next user. But each new selection state creates a new entry. A detail table viewed by twenty users with different filters means twenty results of several hundred megabytes each. The engine frees this cache when memory fills up, but a calculation peak of several gigabytes can saturate a Qlik Sense server. In Qlik Cloud, the memory available to apps is limited too.
Limiting the table’s dimensions (showing the first 1,000 values, for instance) changes nothing: the limit reduces the rows displayed, not the calculation.
The classic solution: ask users to filter
The simplest and safest workaround is to not compute the table while the result is too large, and to tell users how to reduce it. Visualizations in Qlik Sense and Qlik Cloud have a Calculation condition property for this, together with a displayed message shown when the condition is not met.
Capping the number of rows
Count the possible rows with GetPossibleCount() on the key of the fact table. This function computes nothing but the number of possible values of a field: it stays very fast, even on millions of rows.
// Calculation condition of the table
GetPossibleCount(NumDossier) <= 50000

// Displayed message (expression)
='Narrow your selection: '
  & Num(GetPossibleCount(NumDossier), '#,##0')
  & ' rows selected, 50,000 at most.'
As long as the selection contains more than 50,000 files, the table shows the message and the engine does not compute its hypercube. The message gives the number of rows to bring down, which guides users far better than a plain “too much data”.
Requiring some filters
You can also require a filter on fields that make business sense, such as a region or a customer, and combine this requirement with the cap:
// Calculation condition: a region or a customer chosen, and no more than 50,000 rows
(GetSelectedCount(Region) > 0 or GetSelectedCount(Client) > 0)
  and GetPossibleCount(NumDossier) <= 50000
The message can then explain what is missing:
=If(GetSelectedCount(Region) = 0 and GetSelectedCount(Client) = 0,
    'Choose a region or a customer to show the details.',
    'Narrow your selection: '
      & Num(GetPossibleCount(NumDossier), '#,##0')
      & ' rows selected, 50,000 at most.')
What makes the solution comfortable
- Place filter panes on the expected fields next to the table, so users do not have to look for them.
- Show the number of selected rows in a KPI, coloured when it exceeds the cap.
- Set the cap by measuring: 50,000 rows is already far more than a user reads; the right threshold depends on the number of columns and on the server.
- Keep only useful columns in the table: each column enlarges the hypercube.
This solution covers most needs. It has one limitation: until users have filtered enough, they see nothing. When the business really wants to browse every row, another approach is needed.
When you cannot require a filter: manual paging
The idea is to let users browse every row, but have the engine compute only the page on screen.
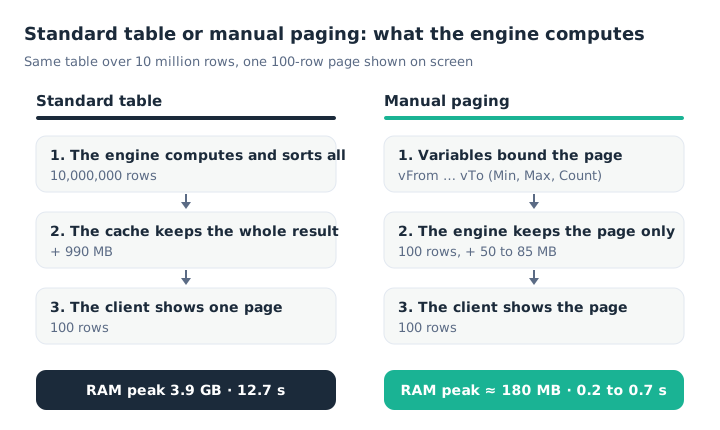
The engine keeps only the page on screen instead of the whole table.
A row key, computed at load time
Everything relies on a RowID key that numbers the rows in the desired display order. The sort happens once and for all, at load time:
Fait:
LOAD *, RowNo() as RowID
Resident FaitTmp
Order By DateOperation desc, NumDossier;

DROP Table FaitTmp;
Two variables to bound the page
The variables compute the RowID range of the current page. The leading = makes each variable evaluate once per selection state, not once per row. In the script, we write # instead of $ and then replace it, so that the $(…) are not expanded at load time:
SET vPageSize = 100;
SET vPage = 1;
LET vTaille  = Replace('=Ceil(#(vPageSize) * (Max(RowID) - Min(RowID) + 1) / Count(RowID))', '#', '$');
LET vNbPages = Replace('=Ceil((Max(RowID) - Min(RowID) + 1) / #(vTaille))', '#', '$');
LET vPageEff = Replace('=RangeMax(1, RangeMin(#(vPage), #(vNbPages)))', '#', '$');
LET vFrom    = Replace('=Min(RowID) + (#(vPageEff) - 1) * #(vTaille)', '#', '$');
LET vTo      = Replace('=#(vFrom) + #(vTaille) - 1', '#', '$');
Each page is a slice of RowID whose width targets vPageSize rows on average among the possible rows. Without a selection, the slice holds exactly 100 rows. With a selection, it holds about 100: we observed between 97 and 120 rows.
vPageEff brings the requested page back within bounds. Qlik Sense has no “on selection change” trigger: without this variable, a user on page 40 who filters down to 3 pages would see an empty table. With it, the table moves to the last page.
Filtering the table on the page
The table keeps its usual dimensions, preceded by RowID. The filter goes into the measures:
Sum({<RowID = {">=$(vFrom)<=$(vTo)"}>} Montant)With zero and null values suppressed (the default setting for tables), only the rows of the page remain in the hypercube.
A variant filters through the dimension instead of the measures. Replace RowID with the following calculated dimension, and clear Include null values:
=If(RowID >= $(vFrom) and RowID <= $(vTo), RowID)Without that setting, rows outside the page stay in the table with an empty number. Both variants perform about the same (see the measurements below).
Navigation buttons
Four buttons, with the Set variable value action on vPage, are enough to browse:
| Button | Value |
|---|---|
| First | 1 |
| Previous | =RangeMax(1, $(vPageEff) - 1) |
| Next | =RangeMin($(vNbPages), $(vPageEff) + 1) |
| Last | =$(vNbPages) |
vPage is a session variable: each user browses without disturbing the others. A text such as ='Page ' & $(vPageEff) & ' / ' & $(vNbPages) shows where you are.
The trap: computing pages by rank
Our first version computed exact pages by rank: Min(RowID, (vPage - 1) * 100 + 1) gives the first RowID of the page. Without a selection, it is fast. But with a selection and a high rank, Min(field, rank) became very expensive: the last page of a 167,000-row selection took between 71 and 140 seconds of engine time, and up to 35 minutes in one run. That is more expensive than the full table.
The slice-based version only uses Min, Max and Count, which stay fast whatever the selection. In exchange, it accepts pages of approximate size.
Limitations of manual paging
- With a selection, pages are approximate, and a page may even be empty if the selection is highly concentrated on a
RowIDrange. - The sort is fixed by
RowID: sorting a column only sorts the current page. To offer several orders, precompute several keys (RowID_Date,RowID_Client…) and pick the key with a variable. - Exports only contain the page on screen.
What it changes: the measurements
We measured the test app on a Qlik Sense Enterprise on Windows server (4 cores, 24 GB of RAM), right after an engine restart, so with an empty cache. Calculation time and RAM peak come from the engine performance log (QixPerformance); cache growth comes from its health check.
| What is displayed | Rows computed | Engine time | RAM peak | Cache added |
|---|---|---|---|---|
| Full table, no selection | 10,000,000 | 12.7 s | 3,888 MB | 990 MB |
| Full table, selection of 166,220 rows | 166,220 | 0.4 s | 219 MB | 99 MB |
| 100-row page (set analysis) | 100 | 0.2 to 0.3 s | 174 MB | 85 MB |
| 100-row page (calculated dimension) | 100 | 0.4 to 0.7 s | 191 MB | 50 to 57 MB |
Three lessons:
- once the result is down to a few hundred thousand rows, the standard table becomes light again: this is what makes the calculation condition so effective;
- manual paging divides the RAM peak by about 20 compared with the full table, without requiring any filter;
- the peak of about 180 MB barely moves from one page to the next: it is most likely the cost of scanning the 10 million rows, not of the rows displayed.
Times vary with server load: the same full table took 136 seconds in a measurement taken while other calculations were running.
Which solution to choose
| Situation | Solution |
|---|---|
| Details only matter after a business filter (customer, file) | Calculation condition with required filters |
| The volume varies, users know how to filter | Capped calculation condition, with a guiding message |
| The business must browse every row | Manual paging, with a calculation condition as a safeguard |
| Fewer than a few hundred thousand rows | Standard table, no special precaution |
Try it in Qlik Sense
The test app is available for download. It ships without data: its script generates 10 million random rows on reload (about 40 seconds and 1 GB of RAM at peak on our server). For a lighter test, lower vNbLignes at the top of the script. The app labels are in French.
Download the test app (.qvf, 180 KB)
It contains three sheets: paging by set analysis, the calculated-dimension variant, and the full table, to open last since it is the one that takes 3.9 GB.
Key takeaways
- A Qlik table is not a browsing grid. The engine computes, sorts and caches the whole result, however much of it is on screen.
- Table paging does not protect the engine. It only splits the display of a result that has already been fully computed.
- The calculation condition is the first line of defence.
GetPossibleCount()caps the volume,GetSelectedCount()requires the right filters, and the message explains what to do. - Manual paging takes over when filtering cannot be required. One
RowIDkey, two variables evaluated once per selection, a set analysis: the peak drops from 3.9 GB to 180 MB.