
· By HeyData team
Series: Henric Cronström’s Technical Briefs, revisited for Qlik Sense · article 4 of 7
Generating missing data in Qlik Sense
A source rarely holds everything an analysis needs. A rate is stored only on the day it changes, a contract only carries its start and end dates, and a calendar exists nowhere at all. In Qlik Sense, the answer lies in the script: you generate the missing rows yourself.
This article summarises the Technical Brief “Generating Missing Data” by Henric Cronström (Qlik, February 2013) and adapts it to Qlik Sense. His technical papers remain references: we revisit them with today’s tools.
The problem
Three situations keep coming back in our projects:
- a whole table is missing, even though it can be derived from other data (the calendar is the classic example);
- rows are missing: business logic says they exist, and users want to click on them. Sometimes a single source row must produce several;
- the rows exist, but a field is empty and should take the value from the row above.
The concrete cases follow: exchange rates known only on the dates they change, stock balances per product, contracts valid over a period, and the master calendar. Everything is handled in the data load editor. The Data Manager does create derived calendar fields, but as far as we know it does not create dates that are absent from the data.
Creating a table: Resident or AutoGenerate
The simplest route is to read an already loaded table again with LOAD DISTINCT … RESIDENT. It has a limit: only the values present in the fact table appear. A day without sales will have no row in the calendar.
To cover a whole range, AUTOGENERATE creates rows out of nothing. No source is read: every value is computed, typically with RecNo() or Rand(). First find the bounds, then generate every date in between:
MinMaxDate:
LOAD Min(Date) as MinDate,
     Max(Date) as MaxDate
RESIDENT Transactions;

LET vMinDate = Peek('MinDate', -1, 'MinMaxDate') - 1;
LET vMaxDate = Peek('MaxDate', -1, 'MinMaxDate');
DROP TABLE MinMaxDate;

MasterCalendar:
LOAD Date,
     Year(Date)  as Year,
     Month(Date) as Month,
     Day(Date)   as Day;
LOAD Date($(vMinDate) + RecNo()) as Date
AUTOGENERATE $(vMaxDate) - $(vMinDate);
The upper LOAD is a preceding load: it derives the calendar fields from the Date key alone. The bounds can also be set differently, for instance from the start of last year to the end of this year with YearStart(Today(), -1) and YearEnd(Today()).
Carrying a value down with Peek
Henric Cronström calls Peek() “my preferred solution” for this need. With no other argument, the function returns a field’s value in the last row already loaded. To replace a NULL with the value from above:
If(IsNull(Rate), Peek('Rate'), Rate) as RatePeek() reads the output table, so a value that has just been carried down is carried again on the next row. Previous() reads the previous source record instead, which is still empty: it does not fit here.
Two conditions frame the technique. Rows must be sorted, and ORDER BY is only accepted on a LOAD … RESIDENT, so two passes are often needed. And if propagation must stay within a group, compare the key with the previous row’s. Example with a running total per product:
TempData:
LOAD Product, Date, Amount FROM [lib://Data/Sales.qvd] (qvd);

Data:
LOAD Product, Date, Amount,
     If(Product = Peek('Product'),
        RangeSum(Amount, Peek('AccumulatedAmount')),
        RangeSum(Amount)) as AccumulatedAmount
RESIDENT TempData
ORDER BY Product, Date;

DROP TABLE TempData;
RangeSum() treats NULL as zero, whereas plain addition would return NULL.
Filling the dates of a rate table
The two building blocks combine. The rate table lists only the days a rate changes. Generate every date in the range, join them to the rates, then sort and carry values down.
TempRates:
LOAD Date, Rate FROM [lib://Data/Rates.qvd] (qvd);

MinMaxDate:
LOAD Min(Date) as MinDate, Max(Date) as MaxDate RESIDENT TempRates;
LET vMinDate = Peek('MinDate', -1, 'MinMaxDate') - 1;
LET vMaxDate = Peek('MaxDate', -1, 'MinMaxDate');
DROP TABLE MinMaxDate;

JOIN (TempRates)
LOAD Date($(vMinDate) + RecNo()) as Date
AUTOGENERATE $(vMaxDate) - $(vMinDate);

Rates:
NOCONCATENATE
LOAD Date,
     If(IsNull(Rate), Peek('Rate'), Rate) as Rate
RESIDENT TempRates
ORDER BY Date;

DROP TABLE TempRates;
NOCONCATENATE is essential: without it, since Rates has the same fields as TempRates, Qlik would append it to the temporary table, which would then be dropped along with it.
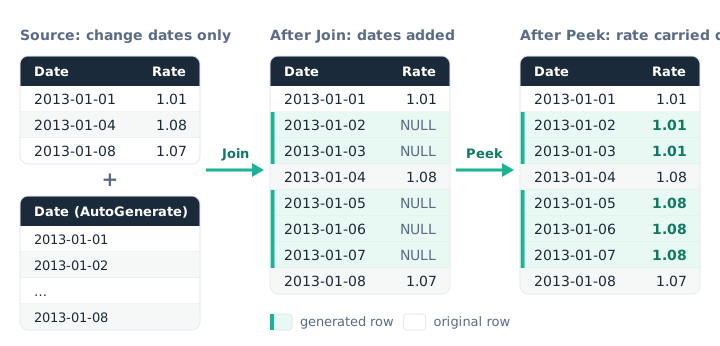
Join adds the missing dates, Peek gives them the last known rate.
Looping inside LOAD: While and SubField
Sometimes one source row must produce several. The WHILE clause replays each record as long as its condition holds, and IterNo() returns the pass number. For insurance contracts, this yields one row per day of validity:
Policies:
LOAD PolicyID, BirthDate, FromDate, ToDate
FROM [lib://Data/Policies.qvd] (qvd);

Policies_x_Dates:
LOAD PolicyID,
     Age(FromDate + IterNo() - 1, BirthDate) as Age,
     Date(FromDate + IterNo() - 1) as ReferenceDate
RESIDENT Policies
WHILE IterNo() <= ToDate - FromDate + 1;
Selecting a ReferenceDate then answers “how many valid contracts on that day?”. The insured person’s age depends on the reference date, so it belongs in the generated table. The data model viewer should show both tables linked by PolicyID.
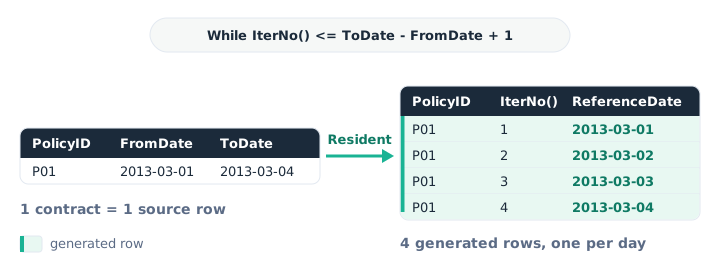
One contract row becomes one row per day of validity.
A LOAD cannot carry both WHERE and WHILE. To combine them, stack two LOAD statements: a filter in the lower LOAD applies before the loop, one in the upper LOAD after it.
When the source holds a list of values in a single field, two-parameter SubField() loops over each item:
Employees_x_Skills:
LOAD [Emp No],
     Trim(SubField(Skills, ',')) as Skill
RESIDENT Employees;
With a third parameter, the function returns a single item and no longer loops.
Every combination: Cartesian product and IntervalMatch
A JOIN between two tables with no common field produces every combination, like an SQL Cartesian product. This is the key to warehouse stock: balances are stored only when they change, and each product has its own dates.
// A. Existing balances, with a product-date key
TempBalances:
LOAD ProductID, Date, Balance,
     ProductID & '|' & Num(Date) as Product_x_DateID
FROM [lib://Data/ProductBalances.qvd] (qvd);

MinMaxDate:
LOAD Min(Date) as MinDate, Max(Date) as MaxDate RESIDENT TempBalances;
LET vMinDate = Peek('MinDate', -1, 'MinMaxDate') - 1;
LET vMaxDate = Peek('MaxDate', -1, 'MinMaxDate');
DROP TABLE MinMaxDate;

// B. Every product-date combination
TempProduct_x_Dates:
LOAD DISTINCT ProductID RESIDENT TempBalances;
JOIN (TempProduct_x_Dates)
LOAD Date($(vMinDate) + RecNo()) as Date
AUTOGENERATE $(vMaxDate) - $(vMinDate);

// C. Append only the missing combinations
CONCATENATE (TempBalances)
LOAD * WHERE NOT Exists(Product_x_DateID);
LOAD ProductID, Date,
     ProductID & '|' & Num(Date) as Product_x_DateID
RESIDENT TempProduct_x_Dates;

// D. Sort and carry the last balance down, per product
ProductBalances:
NOCONCATENATE
LOAD ProductID, Date,
     If(ProductID = Peek('ProductID') and IsNull(Balance),
        Peek('Balance'),
        RangeSum(Balance)) as Balance
RESIDENT TempBalances
ORDER BY ProductID, Date;

// E. Clean up
DROP TABLES TempProduct_x_Dates, TempBalances;
The test on ProductID stops a product from inheriting the previous product’s balance. A product with no balance at the start of the range gets 0, thanks to RangeSum().
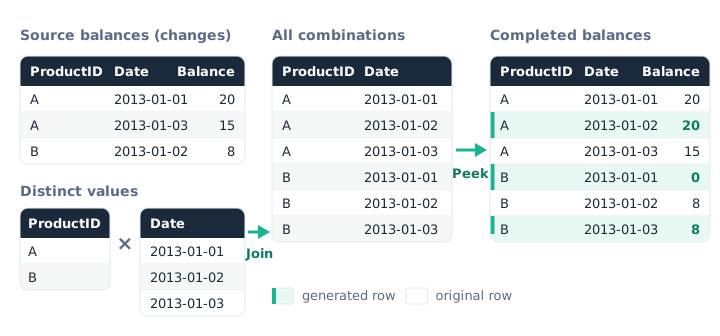
The Cartesian product supplies every product × date pair, Peek completes the balances.
A special case: linking an event date to intervals. Where SQL would use BETWEEN, Qlik Sense offers the IntervalMatch prefix, which generates a bridge table:
IntervalMatchBridge:
IntervalMatch (Date)
LOAD DISTINCT BeginDate, EndDate RESIDENT Intervals;
The data model viewer will show a synthetic key on BeginDate and EndDate. Here it is expected: the pair identifies the interval, and it is the most efficient way to model it.
Bonus: simulations
These techniques are enough for a Monte Carlo simulation. AUTOGENERATE can, for instance, create 100,000 throws of two dice with Ceil(Rand() * 6). A visualization then computes Count(ThrowNo) / Count(TOTAL ThrowNo) per sum of dice. For the running total, the original used RangeSum(Above(…)), still valid in a table. Qlik Sense charts also offer the Accumulation modifier. The paper goes as far as simulating poker hands with a FOR … NEXT loop and GROUP BY loads. Keep statistical uncertainty in mind: running the script several times gives a feel for it.
Key takeaways
- AutoGenerate over Resident. A calendar taken from the facts misses days without activity; a generated range misses none.
- Peek reads the output. It carries down a value already filled in, unlike Previous, which reads the source again.
- Sort before carrying down. ORDER BY only exists on a RESIDENT load: plan a temporary table and a NOCONCATENATE.
- While for intervals. IterNo() turns a start and an end into one row per day.
- Join without a common key. It produces every combination; Where Not Exists adds only the missing ones.
Try it in Qlik Sense
This script replays the article’s examples with the data from the diagrams, loaded INLINE: it needs no file and no database. Paste it into the data load editor of an empty app, pick an example with the vExample variable, then reload.
// Generating missing data in Qlik Sense: try-it script
// Based on “Generating Missing Data”, a Technical Brief by Henric Cronström (Qlik, 2013), adapted by HeyData.
// Paste it into the data load editor of an empty app, pick an example,
// reload, then preview the tables in the data model viewer.
SET vExample = 1;   // 1 to 7

IF $(vExample) = 1 THEN
    // Example 1: a master calendar with no gaps, from the first date to the last
    Transactions:
    LOAD Date(Date#(Date, 'YYYY-MM-DD')) as Date, Amount
    INLINE [
    Date, Amount
    2013-01-01, 120
    2013-01-04, 80
    2013-01-08, 95
    ];

    MinMaxDate:
    LOAD Min(Date) as MinDate,
         Max(Date) as MaxDate
    RESIDENT Transactions;

    LET vMinDate = Peek('MinDate', -1, 'MinMaxDate') - 1;
    LET vMaxDate = Peek('MaxDate', -1, 'MinMaxDate');
    DROP TABLE MinMaxDate;

    MasterCalendar:
    LOAD Date,
         Year(Date)  as Year,
         Month(Date) as Month,
         Day(Date)   as Day;
    LOAD Date($(vMinDate) + RecNo()) as Date
    AUTOGENERATE $(vMaxDate) - $(vMinDate);
    // 8 dates in MasterCalendar, 5 of them without a transaction.
END IF

IF $(vExample) = 2 THEN
    // Example 2: rates known only on the dates they change (first diagram)
    TempRates:
    LOAD Date(Date#(Date, 'YYYY-MM-DD')) as Date, Rate
    INLINE [
    Date, Rate
    2013-01-01, 1.01
    2013-01-04, 1.08
    2013-01-08, 1.07
    ];

    MinMaxDate:
    LOAD Min(Date) as MinDate, Max(Date) as MaxDate RESIDENT TempRates;
    LET vMinDate = Peek('MinDate', -1, 'MinMaxDate') - 1;
    LET vMaxDate = Peek('MaxDate', -1, 'MinMaxDate');
    DROP TABLE MinMaxDate;

    JOIN (TempRates)
    LOAD Date($(vMinDate) + RecNo()) as Date
    AUTOGENERATE $(vMaxDate) - $(vMinDate);

    Rates:
    NOCONCATENATE
    LOAD Date,
         If(IsNull(Rate), Peek('Rate'), Rate) as Rate
    RESIDENT TempRates
    ORDER BY Date;

    DROP TABLE TempRates;
    // 8 rows: 1.01 from the 1st to the 3rd, 1.08 from the 4th to the 7th, 1.07 on the 8th.
END IF

IF $(vExample) = 3 THEN
    // Example 3: a running total that restarts for each product
    TempData:
    LOAD Product, Date(Date#(Date, 'YYYY-MM-DD')) as Date, Amount
    INLINE [
    Product, Date, Amount
    A, 2013-01-01, 10
    B, 2013-01-01, 4
    A, 2013-01-02, 5
    B, 2013-01-03, 6
    A, 2013-01-03, 7
    ];

    Data:
    NOCONCATENATE
    LOAD Product, Date, Amount,
         If(Product = Peek('Product'),
            RangeSum(Amount, Peek('AccumulatedAmount')),
            RangeSum(Amount)) as AccumulatedAmount
    RESIDENT TempData
    ORDER BY Product, Date;

    DROP TABLE TempData;
    // A: 10, 15, 22; B: 4, 10.
END IF

IF $(vExample) = 4 THEN
    // Example 4: one row per day a policy is valid (second diagram)
    Policies:
    LOAD PolicyID,
         Date(Date#(BirthDate, 'YYYY-MM-DD')) as BirthDate,
         Date(Date#(FromDate, 'YYYY-MM-DD'))  as FromDate,
         Date(Date#(ToDate, 'YYYY-MM-DD'))    as ToDate
    INLINE [
    PolicyID, BirthDate, FromDate, ToDate
    P01, 1980-03-02, 2013-03-01, 2013-03-04
    ];

    Policies_x_Dates:
    LOAD PolicyID,
         IterNo() as IterNo,
         Age(FromDate + IterNo() - 1, BirthDate) as Age,
         Date(FromDate + IterNo() - 1) as ReferenceDate
    RESIDENT Policies
    WHILE IterNo() <= ToDate - FromDate + 1;
    // 4 rows, 1 to 4 March; the age goes from 32 to 33 on 2 March.
END IF

IF $(vExample) = 5 THEN
    // Example 5: stock balances completed per product and per day (third diagram)
    // A. Existing balances, with a product-date key
    TempBalances:
    LOAD ProductID, Date, Balance,
         ProductID & '|' & Num(Date) as Product_x_DateID;
    LOAD ProductID, Date(Date#(Date, 'YYYY-MM-DD')) as Date, Balance
    INLINE [
    ProductID, Date, Balance
    A, 2013-01-01, 20
    A, 2013-01-03, 15
    B, 2013-01-02, 8
    ];

    MinMaxDate:
    LOAD Min(Date) as MinDate, Max(Date) as MaxDate RESIDENT TempBalances;
    LET vMinDate = Peek('MinDate', -1, 'MinMaxDate') - 1;
    LET vMaxDate = Peek('MaxDate', -1, 'MinMaxDate');
    DROP TABLE MinMaxDate;

    // B. Every product-date combination
    TempProduct_x_Dates:
    LOAD DISTINCT ProductID RESIDENT TempBalances;
    JOIN (TempProduct_x_Dates)
    LOAD Date($(vMinDate) + RecNo()) as Date
    AUTOGENERATE $(vMaxDate) - $(vMinDate);

    // C. Append only the missing combinations
    CONCATENATE (TempBalances)
    LOAD * WHERE NOT Exists(Product_x_DateID);
    LOAD ProductID, Date,
         ProductID & '|' & Num(Date) as Product_x_DateID
    RESIDENT TempProduct_x_Dates;

    // D. Sort and carry the last balance down, per product
    ProductBalances:
    NOCONCATENATE
    LOAD ProductID, Date,
         If(ProductID = Peek('ProductID') and IsNull(Balance),
            Peek('Balance'),
            RangeSum(Balance)) as Balance
    RESIDENT TempBalances
    ORDER BY ProductID, Date;

    // E. Clean up
    DROP TABLES TempProduct_x_Dates, TempBalances;
    // 6 rows: A 20, 20, 15; B 0, 8, 8.
END IF

IF $(vExample) = 6 THEN
    // Example 6: SubField splits a list into as many rows
    Employees:
    LOAD * INLINE [
    Emp No|Name|Skills
    101|Alice|Qlik Sense, SQL, Python
    102|Bruno|Talend, SQL
    ] (delimiter is '|');

    Employees_x_Skills:
    LOAD [Emp No],
         Trim(SubField(Skills, ',')) as Skill
    RESIDENT Employees;
    // 5 rows: three skills for 101, two for 102.
END IF

IF $(vExample) = 7 THEN
    // Example 7: 100,000 throws of two dice (Monte Carlo simulation)
    Throws:
    LOAD ThrowNo, Die1, Die2, Die1 + Die2 as DiceSum;
    LOAD RecNo()         as ThrowNo,
         Ceil(Rand() * 6) as Die1,
         Ceil(Rand() * 6) as Die2
    AUTOGENERATE 100000;
    // Chart: dimension DiceSum, measure Count(ThrowNo) / Count(TOTAL ThrowNo).
END IF
Source
“Generating Missing Data”, QlikView Technical Brief, Henric Cronström (“hic” on Qlik Community), 4 February 2013. Published on Qlik Community, in the QlikView Documents section. All credit for the original content goes to him; the Qlik Sense adaptation and any errors in it are HeyData’s. This article is part of our review of the Technical Briefs: discover the series.