
· By HeyData team
Series: Henric Cronström’s Technical Briefs, revisited for Qlik Sense · article 5 of 7
IntervalMatch and slowly changing dimensions in Qlik Sense
A dated sale must find the exchange rate, the price or the department that applied on that day. In SQL, a BETWEEN does the job. In the associative model of Qlik Sense, the link has to be built at load time: here is how to do it with IntervalMatch, and how to extend it to slowly changing dimensions.
This article summarises the Technical Brief “IntervalMatch and Slowly Changing Dimensions” by Henric Cronström (Qlik, June 2013) and adapts it to Qlik Sense. His technical papers remain references: we revisit them with today’s tools.
The problem
Take two tables. The first one holds dated events (EventDate). The second one holds intervals, defined by a start bound and an end bound (IntervalBegin, IntervalEnd). They share no field: Qlik cannot associate them.
In the general case, the relationship is many-to-many. An interval contains several events, and an event can fall into several intervals when they overlap. You therefore need a third table, a bridge table, listing every event–interval pair.
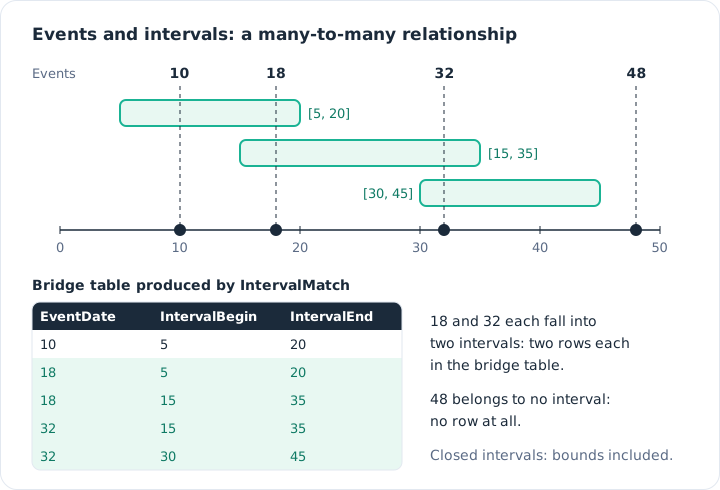
An event can belong to zero, one or several intervals.
Things get harder when a key is added. A salesperson belongs to a department for a given period, then moves to another one. This is a slowly changing dimension (SCD): you must match both the salesperson and the transaction date.
IntervalMatch: the bridge table in one statement
The IntervalMatch prefix is the simplest method. Placed in front of a LOAD that contains only the two bounds, it generates every combination between these intervals and a numeric field loaded earlier. So you load the events first, then the intervals, then the bridge:
Events:
LOAD EventID, EventDate, EventAttribute
FROM [lib://DataFiles/Events.qvd] (qvd);

Intervals:
LOAD IntervalID, IntervalBegin, IntervalEnd, IntervalAttribute
FROM [lib://DataFiles/Intervals.qvd] (qvd);

BridgeTable:
IntervalMatch (EventDate)
LOAD DISTINCT IntervalBegin, IntervalEnd
RESIDENT Intervals;
Everything happens in the data load editor, identically on Qlik Sense SaaS and Client-Managed; as far as we know, Data Manager offers no equivalent.
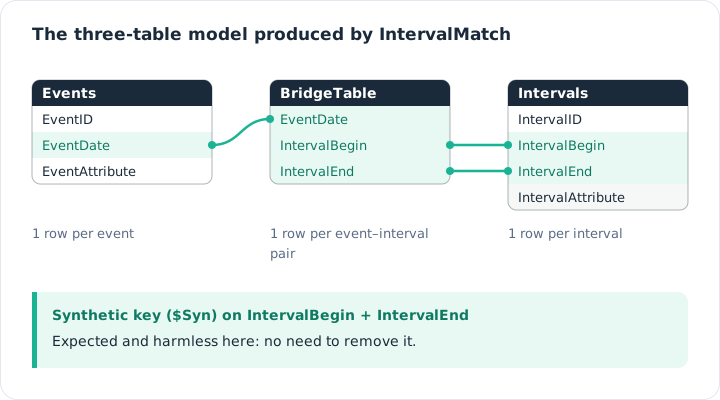
The normalised model: each table keeps exactly its own number of rows.
This model is compact and correct: Events and Intervals stay untouched, so a Count(EventID) remains exact in any visualisation. However, as long as the relationship is many-to-many, do not join the bridge onto one of the original tables: the join would multiply rows and distort aggregations.
The data model viewer will show a synthetic key ($Syn) on IntervalBegin and IntervalEnd. Henric Cronström is clear about it: “This synthetic key should be there”. It does not use excessive memory and does not need to be removed. A synthetic key only needs removing when one of its fields should not act as a key, or when it is built on top of another synthetic key.
Two limits, though: the bridge cannot carry other fields, and IntervalMatch treats every interval as closed, bounds included.
Three alternatives when IntervalMatch is not enough
| Method | Extra fields in the bridge | Intervals handled | Cost |
|---|---|---|---|
IntervalMatch | no | closed only | the simplest, very fast |
While enumerating every value | yes | integers or dates only | fast |
Join then Where filter | yes | open or closed, as you choose | very memory-hungry |
While + Peek(), a “manual” join | yes | open or closed, as you choose | slower, but memory-efficient |
The full join builds the Cartesian product before filtering: keep it for small volumes, or for cases where an additional key limits the combinations. The Peek() loop offers the same flexibility without that memory cost. Here, the interval is half-open:
BridgeTable:
LOAD DISTINCT IntervalID, EventDate
WHERE IntervalBegin <= EventDate AND EventDate < IntervalEnd;
LOAD IntervalID, IntervalBegin, IntervalEnd,
    Peek('EventDate', IterNo() - 1, 'Events') as EventDate
RESIDENT Intervals
WHILE IterNo() <= NoOfRows('Events');
Simplifying the model, carefully
If you know that an event belongs to a single interval, the bridge becomes unnecessary: the interval key can go straight into the events table. You compute a composite key, the same on both sides, and join the bridge onto the events:
Intervals:
LOAD *, AutoNumber(Num(IntervalBegin) & '|' & Num(IntervalEnd)) as IntervalKey
FROM [lib://DataFiles/Intervals.qvd] (qvd);

BridgeTable:
IntervalMatch (EventDate)
LOAD DISTINCT IntervalBegin, IntervalEnd
RESIDENT Intervals;

LEFT JOIN (Events)
LOAD EventDate, AutoNumber(Num(IntervalBegin) & '|' & Num(IntervalEnd)) as IntervalKey
RESIDENT BridgeTable;

DROP TABLE BridgeTable;
Num() makes the key independent of the date format, and AutoNumber() replaces it with a compact integer. This setup also removes the synthetic key. But if an event actually falls into two intervals, the join duplicates rows: check the row count of Events before and after.
Joining the bridge onto the intervals table, on the other hand, is a false good idea: events being far more numerous, that table would swell for no reason.
Open, closed and half-open bounds
When intervals are contiguous, the end of one is the start of the next: with closed bounds, a value falling exactly on that boundary belongs to both. To make it belong to only one, you subtract a tiny amount from the end bound. For dates, DayEnd(IntervalEnd - 1) returns the last millisecond of the previous day.
You can also subtract an epsilon. Too small, it vanishes in floating-point rounding (52 significant bits). For dates, you can go down to Pow(2, -37), slightly less than a microsecond. But below Pow(2, -27), slightly less than a millisecond, the difference stays invisible in date and timestamp formats, which round to the millisecond. Dual() lets you choose the display:
LET vEpsilon = Pow(2, -27);

Intervals:
LOAD IntervalID, IntervalBegin,
    Dual(Date(IntervalEnd), IntervalEnd - $(#vEpsilon)) as IntervalEnd
FROM [lib://DataFiles/Intervals.qvd] (qvd);
The # in $(#vEpsilon) forces a decimal point on expansion: essential in an app set up with a comma as decimal separator.
When the interval only has a start date
Often, the source only stores the change date. An exchange rate, for instance, applies until the next change; an empty date stands for the initial rate. You rebuild the end of each interval in two passes: replace empty dates with the start of the analysis range, then sort by currency and descending date to read the previous row with Peek().
LET vBeginTime = Num(MakeDate(2013, 1, 1));
LET vEndTime   = Num(Now());
LET vEpsilon   = Pow(2, -27);

Tmp_Rates:
LOAD Currency, Rate,
    Date(If(IsNum([Change Date]), [Change Date], $(#vBeginTime))) as FromDate
FROM [lib://DataFiles/Rates.xlsx] (ooxml, embedded labels, table is Rates);

Rates:
LOAD Currency, Rate, FromDate,
    Date(If(Currency = Peek('Currency'),
            Peek('FromDate') - $(#vEpsilon),
            $(#vEndTime))) as ToDate
RESIDENT Tmp_Rates
ORDER BY Currency, FromDate DESC;

DROP TABLE Tmp_Rates;
MakeDate() avoids depending on the app’s date format, unlike a string such as '1/1/2013'.
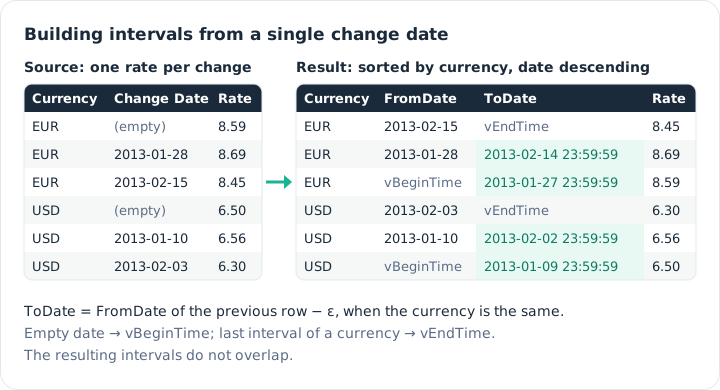
One change date per row becomes a non-overlapping interval.
Slowly changing dimensions
First requirement: the history must exist. If the source overwrites the old department, past sales move to the new one and no script can fix it. Usually, the source keeps one row per version with its change date, often in a dynamic table (SalespeopleDyn) separate from the stable attributes (Salespeople). Once the intervals are rebuilt as above, the extended form of IntervalMatch accepts additional keys:
IntervalMatch (TransactionDate, SPID)
LOAD DISTINCT FromDate, ToDate, SPID
RESIDENT SalespeopleDyn;
Leaving this bridge as is does not work: SPID and the dates then link the tables through several paths, and the model becomes wrong. The bridge must be the only link between facts and dimensions, through two composite keys. On the transaction side, [SPID+TransDate]. On the dimension side, [SPID+Interval]. And SPID must no longer appear in the fact table:
SalespeopleDyn:
LOAD *, SPID & '|' & FromDate & '|' & ToDate as [SPID+Interval]
FROM [lib://DataFiles/SalespeopleDyn.qvd] (qvd);

Transactions:
LOAD TransactionID, TransactionDate, ProductID, Amount,
    SPID as TmpSPID,
    SPID & '|' & TransactionDate as [SPID+TransDate]
FROM [lib://DataFiles/Transactions.qvd] (qvd);

Tmp_BridgeTable:
IntervalMatch (TransactionDate, TmpSPID)
LOAD DISTINCT FromDate, ToDate, SPID as TmpSPID
RESIDENT SalespeopleDyn;

BridgeTable:
LOAD TmpSPID & '|' & TransactionDate as [SPID+TransDate],
    TmpSPID & '|' & FromDate & '|' & ToDate as [SPID+Interval]
RESIDENT Tmp_BridgeTable;

DROP FIELD TmpSPID;
DROP TABLE Tmp_BridgeTable;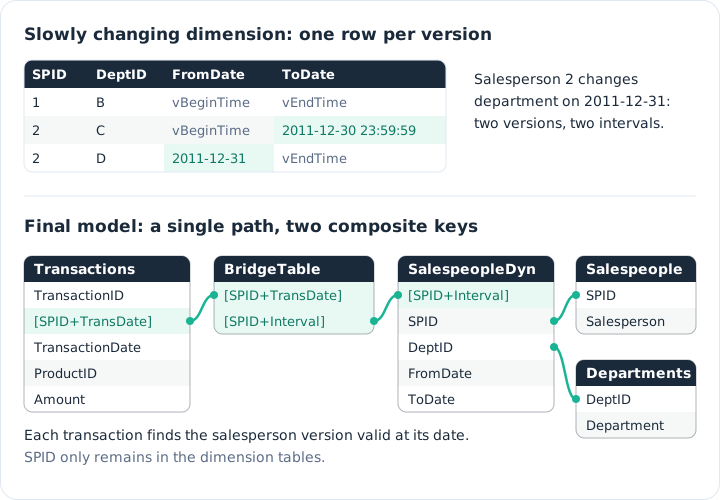
Each transaction finds the salesperson version valid at its date.
In most cases, a salesperson belongs to one department at a time: the relationship is many-to-one. You can then join the bridge onto the fact table with LEFT JOIN (Transactions) on TmpSPID and TransactionDate; the [SPID+TransDate] key becomes unnecessary. Henric Cronström warns, however, that he has seen this certainty contradicted by the data more than once: check the row count before joining. A variant without IntervalMatch: enumerate the dates of each interval with a While loop into a mapping table, then set [SPID+Interval] with ApplyMap() when loading the transactions.
Several interval tables
When several interval tables meet, the key technique is partitioning: splitting overlapping intervals into elementary sub-intervals, so that each event belongs to only one of them. You gather all starts and ends into a single field, then turn them back into intervals with the single-date method, salesperson by salesperson.
First case: incidents and work shifts, both bounded in time and tied to a machine. Which shift handled which incident? Slicing time into minutes would work, at the cost of a large volume and rounding; it is better to link both tables to a common sub-interval table. Second case, the two-level SCD: the salesperson changes department, the department changes unit. You join the two dynamic tables on the department, keep the periods that overlap, bounded by RangeMax() of the starts and RangeMin() of the ends, then link them to the transactions like a simple SCD.
Key takeaways
- IntervalMatch first. Three tables and an accepted synthetic key: the simplest and most accurate model for a many-to-many relationship.
- A synthetic key is not a flaw. The one created by IntervalMatch is harmless; only remove it when the model requires it.
- Joining is a bet. Only join the bridge onto the facts if the relationship really is many-to-one, and check the row count.
- Mind the bounds. For contiguous intervals, subtract an epsilon or use
DayEnd()so that a boundary value belongs to a single interval. - A change date is enough.
Peek()over a table sorted in descending order rebuilds the end of each interval. - For an SCD, a single path. Two composite keys and
SPIDremoved from the facts: each transaction finds the right version of the dimension.
Try it in Qlik Sense
This script replays the article’s examples with the data from the diagrams, loaded INLINE: it needs no file and no database. Paste it into the data load editor of an empty app, pick an example with the vExample variable, then reload.
// IntervalMatch and slowly changing dimensions: try-it script
// Based on “IntervalMatch and Slowly Changing Dimensions”, a Technical Brief by Henric Cronström (Qlik, 2013), adapted by HeyData.
// Paste it into the data load editor of an empty app, pick an example,
// reload, then open the data model viewer.
SET vExample = 1;   // 1 to 5

IF $(vExample) <= 3 THEN
    // Examples 1 to 3: four events and three closed intervals (first diagram)
    Events:
    LOAD * INLINE [
    EventID, EventDate, EventAttribute
    E1, 10, a
    E2, 18, b
    E3, 32, c
    E4, 48, d
    ];

    Intervals:
    LOAD * INLINE [
    IntervalID, IntervalBegin, IntervalEnd, IntervalAttribute
    I1, 5, 20, x
    I2, 15, 35, y
    I3, 30, 45, z
    ];
END IF

IF $(vExample) = 1 THEN
    // Example 1: IntervalMatch creates the bridge table (second diagram)
    BridgeTable:
    IntervalMatch (EventDate)
    LOAD DISTINCT IntervalBegin, IntervalEnd
    RESIDENT Intervals;
    // 5 rows: 18 and 32 twice, 48 never. The synthetic key is expected.
END IF

IF $(vExample) = 2 THEN
    // Example 2: the same bridge table with a While loop, half-open bounds
    BridgeTable:
    LOAD DISTINCT IntervalID, EventDate
    WHERE IntervalBegin <= EventDate AND EventDate < IntervalEnd;
    LOAD IntervalID, IntervalBegin, IntervalEnd,
        Peek('EventDate', IterNo() - 1, 'Events') as EventDate
    RESIDENT Intervals
    WHILE IterNo() <= NoOfRows('Events');
    // No synthetic key: the bridge only holds IntervalID and EventDate.
END IF

IF $(vExample) = 3 THEN
    // Example 3: the bridge joined to the events, with a compact interval key
    RENAME TABLE Intervals TO TmpIntervals;
    Intervals:
    NOCONCATENATE
    LOAD *, AutoNumber(Num(IntervalBegin) & '|' & Num(IntervalEnd)) as IntervalKey
    RESIDENT TmpIntervals;
    DROP TABLE TmpIntervals;

    BridgeTable:
    IntervalMatch (EventDate)
    LOAD DISTINCT IntervalBegin, IntervalEnd
    RESIDENT Intervals;

    LEFT JOIN (Events)
    LOAD EventDate, AutoNumber(Num(IntervalBegin) & '|' & Num(IntervalEnd)) as IntervalKey
    RESIDENT BridgeTable;

    DROP TABLE BridgeTable;
    // Events grows from 4 to 6 rows: 18 and 32 are duplicated. Always check this count.
END IF

IF $(vExample) = 4 THEN
    // Example 4: intervals built from a change date (third diagram)
    LET vBeginTime = Num(MakeDate(2013, 1, 1));
    LET vEndTime   = Num(Now());
    LET vEpsilon   = Pow(2, -27);

    Tmp_Rates:
    LOAD Currency, Rate,
        Date(If(IsNum(Date#([Change Date], 'YYYY-MM-DD')),
                Date#([Change Date], 'YYYY-MM-DD'),
                $(#vBeginTime))) as FromDate
    INLINE [
    Currency, Change Date, Rate
    EUR, , 8.59
    EUR, 2013-01-28, 8.69
    EUR, 2013-02-15, 8.45
    USD, , 6.50
    USD, 2013-01-10, 6.56
    USD, 2013-02-03, 6.30
    ];

    Rates:
    LOAD Currency, Rate, FromDate,
        Timestamp(If(Currency = Peek('Currency'),
                     Peek('FromDate') - $(#vEpsilon),
                     $(#vEndTime))) as ToDate
    RESIDENT Tmp_Rates
    ORDER BY Currency, FromDate DESC;

    DROP TABLE Tmp_Rates;
    // EUR 8.69: from 2013-01-28 to 2013-02-14 23:59:59; intervals do not overlap.
END IF

IF $(vExample) = 5 THEN
    // Example 5: a slowly changing dimension (fourth diagram)
    LET vBeginTime = Num(MakeDate(2010, 1, 1));
    LET vEndTime   = Num(Now());

    Salespeople:
    LOAD * INLINE [
    SPID, Salesperson
    1, Alice
    2, Bruno
    ];

    Departments:
    LOAD * INLINE [
    DeptID, Department
    B, Retail
    C, Wholesale
    D, Export
    ];

    SalespeopleDyn:
    LOAD *, SPID & '|' & FromDate & '|' & ToDate as [SPID+Interval];
    LOAD SPID, DeptID,
        Timestamp(If(Len(From), Date#(From, 'YYYY-MM-DD'), $(#vBeginTime))) as FromDate,
        Timestamp(If(Len(To), DayEnd(Date#(To, 'YYYY-MM-DD')), $(#vEndTime))) as ToDate
    INLINE [
    SPID, DeptID, From, To
    1, B, ,
    2, C, , 2011-12-30
    2, D, 2011-12-31,
    ];

    Transactions:
    LOAD TransactionID, TransactionDate, ProductID, Amount,
        SPID as TmpSPID,
        SPID & '|' & TransactionDate as [SPID+TransDate];
    LOAD TransactionID, Date(Date#(TransactionDate, 'YYYY-MM-DD')) as TransactionDate,
        ProductID, Amount, SPID
    INLINE [
    TransactionID, TransactionDate, SPID, ProductID, Amount
    T1, 2011-06-15, 2, P1, 300
    T2, 2012-02-10, 2, P2, 450
    T3, 2011-09-01, 1, P1, 120
    ];

    Tmp_BridgeTable:
    IntervalMatch (TransactionDate, TmpSPID)
    LOAD DISTINCT FromDate, ToDate, SPID as TmpSPID
    RESIDENT SalespeopleDyn;

    BridgeTable:
    LOAD TmpSPID & '|' & TransactionDate as [SPID+TransDate],
        TmpSPID & '|' & FromDate & '|' & ToDate as [SPID+Interval]
    RESIDENT Tmp_BridgeTable;

    DROP FIELD TmpSPID;
    DROP TABLE Tmp_BridgeTable;
    // T1 (2011) is linked to department C, T2 (2012) to department D.
END IF
Source
“IntervalMatch and Slowly Changing Dimensions”, Henric Cronström (“hic” on Qlik Community), QlikView Technical Brief, 3 June 2013, published on Qlik Community in the QlikView Documents section. All credit for the original content goes to him; the adaptation to Qlik Sense and any errors in it are HeyData’s.
This article is part of a series on Qlik Technical Briefs. Discover the series to find the other papers we have revisited.