· By HeyData team
Series: Henric Cronström’s Technical Briefs, revisited for Qlik Sense · article 6 of 7
Hierarchies in Qlik Sense: from parent-child table to access rights
A parent-child table describes a tree perfectly, but Qlik Sense cannot use it as it stands. Two script prefixes, Hierarchy and HierarchyBelongsTo, turn it into usable fields. With them, you get levels for pivot tables, selection of a whole sub-tree and access rights by branch.
This article summarises the Technical Brief “Hierarchies” by Henric Cronström (Qlik, November 2013) and adapts it to Qlik Sense. His technical papers remain references: we revisit them with today’s tools.
The problem
A hierarchy is a set of nodes that each have a single parent. The calendar, the product range, geography and the organisation chart are examples. The leaves are usually the transactions in the fact table, each linked to one node.
Not all hierarchies look alike. Four questions help to describe them:
- Balanced or not? In a balanced hierarchy, all transactions point to the same level. The calendar usually is: every order has a date.
- Fixed or variable number of levels? A hierarchy can keep a fixed number of levels and still be unbalanced: a budget entered by month next to sales entered by day.
- Named levels or not? “Country” or “City” deserve their own field. Wine districts have no stable level name: a district can sit on the third level as well as the fifth.
- Ragged? A level is missing on some branches. Washington DC belongs to the United States without belonging to any state.
The simple case, named and fixed levels, is handled with a drill-down dimension. The hard case is the unbalanced hierarchy with variable depth. It almost always arrives as an adjacency table.
How the source stores the tree
Relational databases have several ways of storing a hierarchy. Start by identifying yours:
- Horizontal: one field per level (customer, country, region), sometimes spread across several linked tables.
- Adjacency table: one row per node, with a key to its parent. It is the most common format, because moving a branch only means changing one
ParentID. - Path enumeration: each node stores its full path (
1/178/281). - Nested sets: each node carries a lower and an upper bound that enclose those of its descendants.
- Ancestor table: one row per ancestor / descendant pair. Rare as storage, common as an SQL view.
Adjacency, paths and nested sets fully describe the tree, but none can be used as is. The Hierarchy and HierarchyBelongsTo prefixes start from the adjacency table.
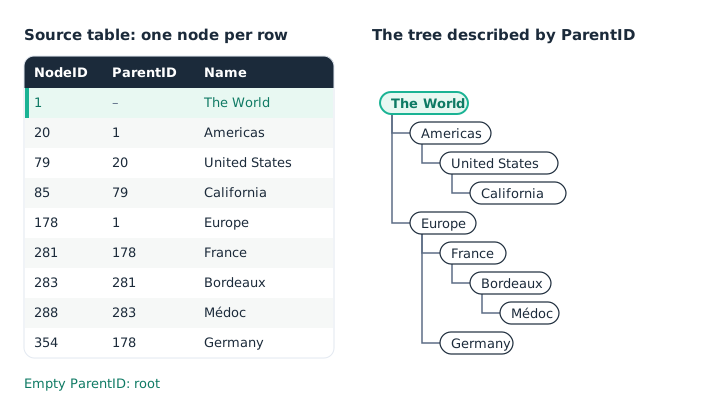
An adjacency table: each row only knows its parent.
Named levels: a drill-down dimension is enough
If the levels have names and all transactions point to the same level, load the table as it is. Then create a drill-down dimension in the master items (Year > Quarter > Month, for example). It replaces the QlikView hierarchical group and works in every chart. When only one value remains possible at a level, the visualization moves down to the next one.
If facts point to different levels, such as budget by month and actuals by day, the hierarchy is unbalanced. The Technical Brief then refers to generic keys, covered in another article of the series.
Hierarchy: one field per level
The Hierarchy prefix goes in front of a LOAD that reads the adjacency table. It requires three fields: the node ID, the parent ID and a name. A parent that is empty or cannot be found makes the node a root. If the source has no label, NodeID as Name will do.
// Expanded nodes table: one row per node, one column per level
[Nodes]:
Hierarchy (NodeID, ParentID, Node, NodeParent, Node, NodePath, '/', NodeDepth)
LOAD
    NodeID,
    ParentID,
    NodeName as Node
FROM [lib://DataFiles/WineDistricts.qvd] (qvd);
The result keeps one row per node and adds Node1 to NodeN, one field per level. The optional parameters add the parent name, the path (NodePath) and the depth (NodeDepth).
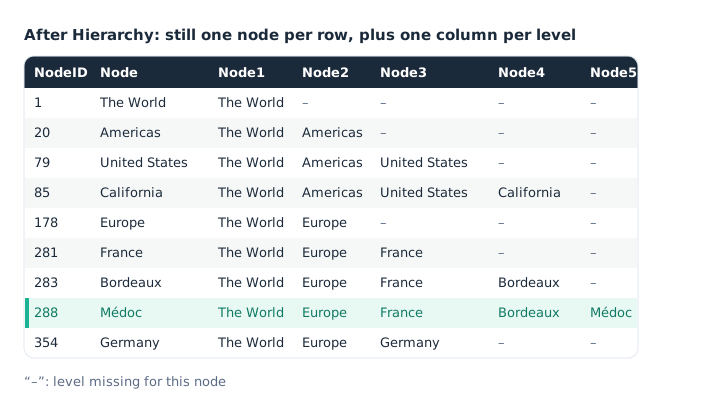
After Hierarchy: each node’s lineage reads from left to right.
In Qlik Sense, Node1, Node2… serve as rows in a pivot table. Amounts linked directly to an intermediate node show up on an empty-level row (“–”) under that node. Depending on the version, the indent rows option brings the display closer to a tree.
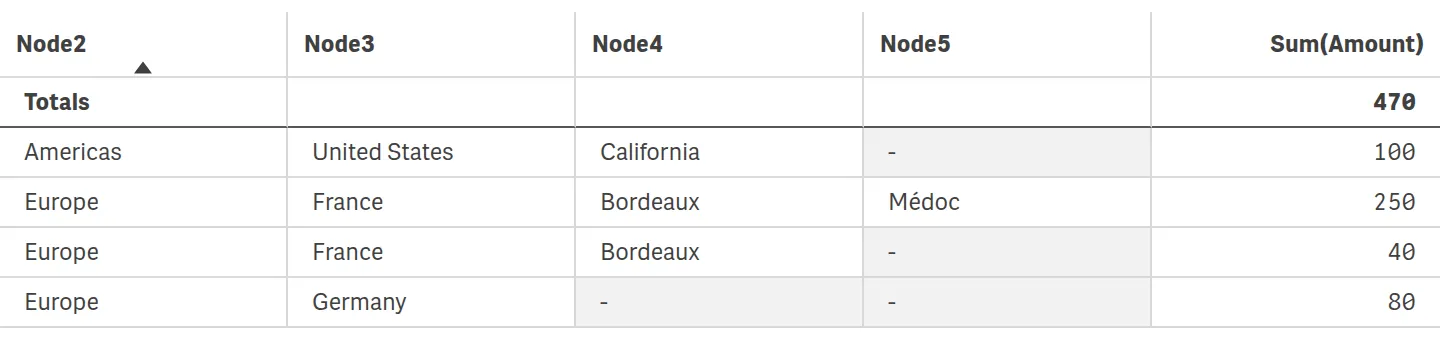
In Qlik Cloud: the 40 attached to Bordeaux, an intermediate node, show on a row whose next level is empty.
QlikView displayed NodePath in a list box in tree view. Qlik Sense has no native equivalent in the filter pane. To display the tree, the org chart from the Visualization bundle works from an ID / parent pair. To navigate, we rather use a drill-down dimension on the levels.
HierarchyBelongsTo: selecting a sub-tree
The nodes table has a limit. It lets you select one node, but not “Europe and everything in it”. Yet that is the most natural selection. The HierarchyBelongsTo prefix meets this need.
// Ancestor table: one row per node / ancestor pair
[TreeBridge]:
HierarchyBelongsTo (NodeID, ParentID, NodeName, TreeID, TreeName)
LOAD
    NodeID,
    ParentID,
    NodeName
FROM [lib://DataFiles/WineDistricts.qvd] (qvd);
It produces an ancestor table: each node appears once per ancestor, itself included. An optional sixth parameter adds the depth difference between the node and the ancestor.
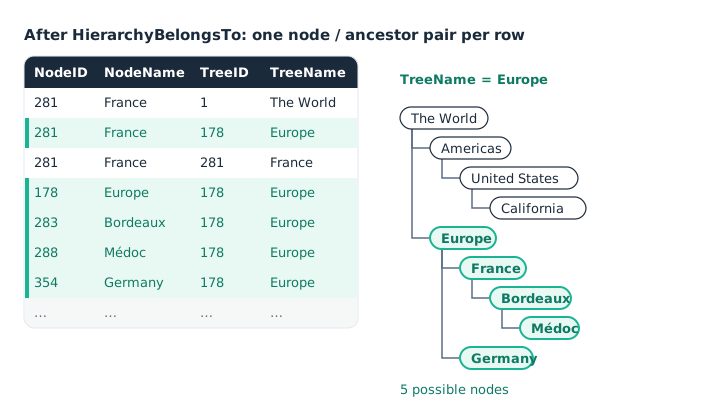
Selecting Europe in TreeName makes the whole branch possible.
The field holding the node name must be called something other than in the Nodes table: NodeName here, Node there. Otherwise the two tables share two fields and Qlik creates a synthetic key. The data model viewer lets you check this after reloading.
Finally, you can load the hierarchy a second time with Hierarchy, this time on the tree IDs. Its Tree1 to TreeN fields feed a drill-down dimension that navigates from sub-tree to sub-tree.
[Trees]:
Hierarchy (TreeID, TreeParentID, Tree)
LOAD
    NodeID as TreeID,
    ParentID as TreeParentID,
    NodeName as Tree
FROM [lib://DataFiles/WineDistricts.qvd] (qvd);
The complete model
Each of the three tables has its own role. Not all of them are required: load only those your analyses need.
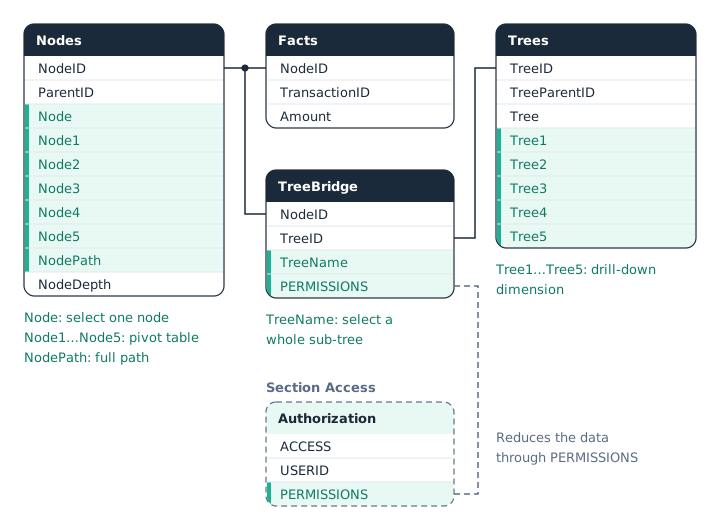
Nodes for levels, TreeBridge for sub-trees, Trees for drill-down.
Access rights by branch
A hierarchy also serves security. In an organisation chart, a manager should see their department and all its sub-departments, but not the others. TreeName is the right reduction field: granting “Product” grants the whole Product sub-tree.
When the source is an adjacency table, you only need to derive an upper-case copy of TreeName. Reduction values in Section Access must indeed be in upper case.
// TempTreeBridge was loaded with HierarchyBelongsTo
[TreeBridge]:
LOAD *, Upper(TreeName) as PERMISSIONS
RESIDENT [TempTreeBridge];
DROP TABLE [TempTreeBridge];

Section Access;
Authorization:
LOAD
    ACCESS,
    USERID,
    Upper(Permissions) as PERMISSIONS
FROM [lib://DataFiles/Organization.xlsx] (ooxml, embedded labels, table is Access);
Section Application;
On Client-Managed, USERID takes the form DOMAIN\user. Do not forget the INTERNAL\SA_SCHEDULER row as ADMIN, or scheduled reloads will fail. On SaaS, check the user identifier format your tenant expects. The Technical Brief also mentioned reduction through QlikView Publisher; Qlik Sense relies on Section Access.
When the hierarchy is horizontal, HierarchyBelongsTo does not apply. You then build the bridge table by hand: a loop over the level fields is enough.
FOR EACH vLevel IN 'Board level', 'Top level', 'Department', 'Unit'
    Trees:
    LOAD DISTINCT
        DepartmentID,
        Upper([$(vLevel)]) as PERMISSIONS
    RESIDENT [Horizontal Hierarchy];
NEXT vLevel
Each department gets one row per level that contains it: a “CEO” permission opens the whole branch under the CEO.
Checking source integrity
Unbalanced hierarchies often suffer from inconsistent data. Three defects deserve a check before loading:
- Duplicates and multiple parents: a node described twice, or linked to two parents, multiplies the rows produced (two, four, eight…) depending on how many ancestors are affected. The display becomes inconsistent and performance degrades.
- Missing parents: a
ParentIDwith no matching row, often the root, creates several roots. These roots cannot be selected. - Circular references: A has B as parent, B has C, C has A. Resolution breaks the loop by removing a link, or even excludes nodes. Henric Cronström recommends always avoiding them.
// Duplicates and multiple parents
CheckNodes:
LOAD
    NodeID,
    Count(NodeID) as NoOfInstances,
    Count(DISTINCT ParentID) as NoOfParents
RESIDENT Source
GROUP BY NodeID;

// Parents that are not listed as nodes
CheckParents:
LOAD
    NodeID,
    If(Exists(NodeID, ParentID), 'Existing', 'Missing') as ParentExistence
RESIDENT Source;
Legitimate roots, with no parent, also come out as “Missing”: that is expected. For cycles, the paper suggests a loop that walks down the tree level by level. It stops when no node is added any more, or when a node reappears among its own ancestors. Drop these check tables once the analysis is done.
Key takeaways
- Identify the source format. Horizontal, adjacency, paths, nested sets or ancestors: loading depends on it.
- Named levels, drill-down. A drill-down dimension in the master items is enough when levels are named and fixed.
- Hierarchy for levels. The prefix adds one field per level, the path and the depth, without changing the number of rows.
- HierarchyBelongsTo for sub-trees. The ancestor table lets you select a whole branch in one click.
- Distinct field names. Name the node differently in each table to avoid synthetic keys.
- Reduction by branch. The ancestor name, in upper case, becomes the Section Access reduction field.
- Check the source. Duplicates, missing parents and cycles distort the tree: check them before loading.
Try it in Qlik Sense
This script replays the article’s examples with the data from the diagrams, loaded INLINE: it needs no file and no database. Paste it into the data load editor of an empty app, pick an example with the vExample variable, then reload.
// Hierarchies in Qlik Sense: try-it script
// Based on “Hierarchies”, a Technical Brief by Henric Cronström (Qlik, 2013), adapted by HeyData.
// Paste it into the data load editor of an empty app, pick an example,
// reload, then open the data model viewer.
SET vExample = 1;   // 1 to 3

IF $(vExample) = 1 THEN
    // Example 1: the complete model (the article's four diagrams)
    // Adjacency table: one node per row, empty ParentID for the root
    Source:
    LOAD NodeID, If(Len(ParentID), ParentID) as ParentID, NodeName
    INLINE [
    NodeID, ParentID, NodeName
    1, , The World
    20, 1, Americas
    79, 20, United States
    85, 79, California
    178, 1, Europe
    281, 178, France
    283, 281, Bordeaux
    288, 283, Médoc
    354, 178, Germany
    ];

    // Expanded nodes: one column per level
    [Nodes]:
    Hierarchy (NodeID, ParentID, Node, NodeParent, Node, NodePath, '/', NodeDepth)
    LOAD NodeID, ParentID, NodeName as Node
    RESIDENT Source;

    // Ancestor table: one node / ancestor pair per row
    [TempTreeBridge]:
    HierarchyBelongsTo (NodeID, ParentID, NodeName, TreeID, TreeName)
    NoConcatenate LOAD NodeID, ParentID, NodeName
    RESIDENT Source;

    [TreeBridge]:
    NoConcatenate
    LOAD *, Upper(TreeName) as PERMISSIONS
    RESIDENT [TempTreeBridge];
    DROP TABLE [TempTreeBridge];

    // Trees: Tree1 to Tree5 for a drill-down dimension
    [Trees]:
    Hierarchy (TreeID, TreeParentID, Tree)
    LOAD NodeID as TreeID, ParentID as TreeParentID, NodeName as Tree
    RESIDENT Source;

    DROP TABLE Source;

    Facts:
    LOAD * INLINE [
    TransactionID, NodeID, Amount
    T1, 85, 100
    T2, 288, 250
    T3, 283, 40
    T4, 354, 80
    ];

    // Branch-level rights, loaded here as an ordinary table.
    // In Section Access they would reduce the data; only add it to a copy,
    // with an ADMIN row for your own account.
    Authorization:
    LOAD ACCESS, USERID, Upper(Permissions) as PERMISSIONS
    INLINE [
    ACCESS, USERID, Permissions
    USER, ALICE, Europe
    USER, BOB, Americas
    ];
    // TreeName = Europe: 5 possible nodes, Sum(Amount) = 370.
    // USERID = ALICE: the same data, through PERMISSIONS.
END IF

IF $(vExample) = 2 THEN
    // Example 2: checking the integrity of a faulty source
    Source:
    LOAD * INLINE [
    NodeID, ParentID, NodeName
    178, 1, Europe
    281, 178, France
    283, 281, Bordeaux
    283, 178, Bordeaux
    400, 999, Orphan
    ];

    // Duplicates and multiple parents
    CheckNodes:
    LOAD
        NodeID,
        Count(NodeID) as NoOfInstances,
        Count(DISTINCT ParentID) as NoOfParents
    RESIDENT Source
    GROUP BY NodeID;

    // Parents that are not listed as nodes
    CheckParents:
    LOAD
        NodeID,
        If(Exists(NodeID, ParentID), 'Existing', 'Missing') as ParentExistence
    RESIDENT Source;
    // 283 has two parents; 178 (parent 1) and 400 (parent 999) have a missing parent.
END IF

IF $(vExample) = 3 THEN
    // Example 3: a horizontal hierarchy, without HierarchyBelongsTo
    [Horizontal Hierarchy]:
    LOAD * INLINE [
    DepartmentID, Board level, Top level, Department, Unit
    D1, CEO, Sales, Retail, Shops
    D2, CEO, Sales, Wholesale, Key accounts
    D3, CEO, Operations, Logistics, Warehouse
    ];

    FOR EACH vLevel IN 'Board level', 'Top level', 'Department', 'Unit'
        Trees:
        LOAD DISTINCT
            DepartmentID,
            Upper([$(vLevel)]) as PERMISSIONS
        RESIDENT [Horizontal Hierarchy];
    NEXT vLevel
    // PERMISSIONS = SALES: D1 and D2; PERMISSIONS = CEO: all three departments.
END IF
Source
“Hierarchies”, QlikView Technical Brief, Henric Cronström (“hic” on Qlik Community), 26 November 2013, published on Qlik Community in the QlikView Documents section. All credit for the original content goes to him; the Qlik Sense adaptation, and any errors in it, are HeyData’s.
This article is part of our revisit of the Technical Briefs: discover the series and the other papers adapted to Qlik Sense.