
· By HeyData team
Series: Lesser-known Qlik Sense functions and keywords: a series · article 4 of 13
Above, Below, RangeSum: inter-record functions in Qlik Sense charts
Showing the variance with the previous month, a year-to-date running total or a three-month moving average: in a Qlik Sense table, these calculations work not on the data but on the rows displayed. Inter-record functions, Above() first among them, read the value of another row of the chart. They are simple to write, and easy to misread.
This article is part of our series on lesser-known Qlik Sense functions and keywords. It is based on the Qlik help; links are at the end of the article.
Above() and the column segment
Above(Sum(Sales)) returns the value of Sum(Sales) on the row above. But “the row above” means within the column segment: the set of rows that share the same values for every dimension except the last one. In a table by region and month, each region forms a segment.
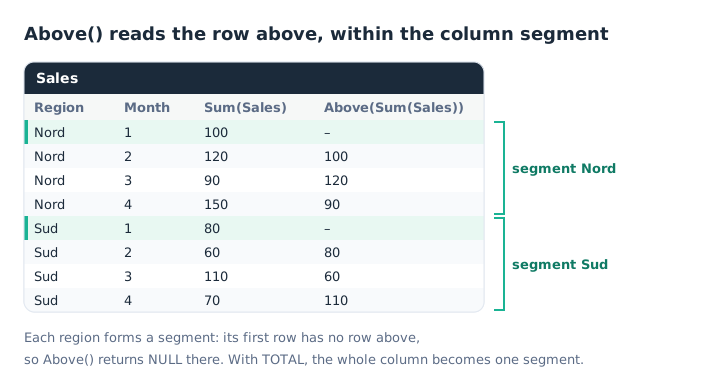
Month 1 of Sud does not read month 4 of Nord: it heads its own segment.
The first row of each segment has nothing above it: Above() returns NULL there. The TOTAL qualifier, Above(TOTAL Sum(Sales)), turns the whole column into a single segment.
The full syntax:
Above([TOTAL] expression [, offset [, count]])offset: the number of rows to go up, 1 by default. 0 means the current row; a negative value looks down, likeBelow().count: above 1, the function returns a range of values, which theRange*()functions can aggregate.
Variance, running total, moving average
Three expressions cover most needs:
Sum(Sales) - Above(Sum(Sales))                  // variance with the previous row
RangeSum(Above(Sum(Sales), 0, RowNo()))         // running total from the start of the segment
RangeAvg(Above(Sum(Sales), 0, 3))               // 3-row moving average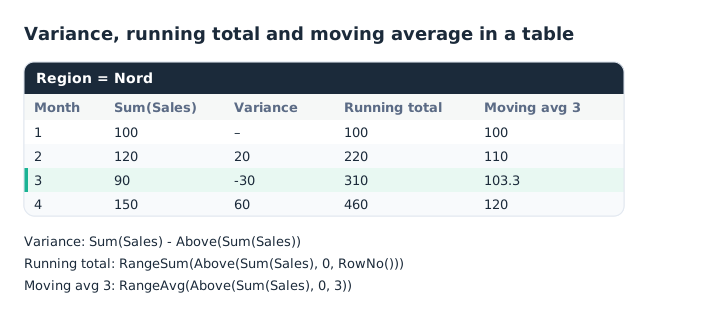
The same results as the Window() script function, but computed in the chart.
RowNo() gives the row number within its segment: used as count, it makes Above() reach back to the first row. RangeSum() and RangeAvg() ignore NULLs, which handles the first rows. The result is identical to that of the Window() script function on the same data, with one fundamental difference: here, the calculation follows selections.
The whole family
Below(): the row below.Top()andBottom(): the first and last row of the segment, useful for a base-100 index (Sum(Sales) / Top(Sum(Sales))).RowNo()andNoOfRows(): the row number and the number of rows in the segment.Before(),After(),First()andLast(): the column equivalents, in a pivot table, when the time dimension is in columns.
What skews the result
These functions work on what is displayed, not on the data. Three consequences:
- Sorting matters. The row above depends on the chart’s sort order. Qlik Sense actually disables sorting by measure value as soon as an expression uses an inter-record function.
- Selections matter. If the user excludes month 2, month 3’s previous row is month 1. The variance changes meaning without any warning.
- Hidden rows matter too. A hidden zero row, or a missing value, does not exist for
Above().
For a calculation that must not depend on the display, there are two options: an Aggr() with an explicit sort, described in our article on Aggr() pitfalls, or a calculation in the script with Window() or Peek().
Without an expression: modifiers
For simple cases, Qlik Sense charts and tables offer measure modifiers that need no formula: Accumulation, Moving average, Difference and Relative numbers. The Qlik help shows they are built on Above(), RangeSum() and RangeAvg(): they therefore share the same limits. Their advantage: they stay readable for anyone who takes over the app.
Key takeaways
- The row above, within the segment. Above() reads the previous row among those sharing the same dimensions, except the last one.
- TOTAL for the whole column. Without it, each segment starts again.
- A count for a range.
Above(expr, 0, 3)returns three values, to aggregate with RangeSum or RangeAvg. - RowNo() to accumulate.
RangeSum(Above(Sum(Sales), 0, RowNo()))accumulates from the first row. - The result follows the display. Sorting, selections and hidden rows change the previous row.
- A modifier for simple cases. Accumulation, moving average and difference exist without a formula.
Try it in Qlik Sense
This script loads the diagrams’ data INLINE. Paste it into the data load editor of an empty app and reload. Then build a table with the Region and Month dimensions and the measures listed in the comments.
// Inter-record functions in Qlik Sense: try-it script (HeyData)
// Paste it into the data load editor of an empty app, reload,
// then build a table with the Region and Month dimensions, sorted by Region then Month.
Sales:
LOAD * INLINE [
Region, Month, Sales
Nord, 1, 100
Nord, 2, 120
Nord, 3, 90
Nord, 4, 150
Sud, 1, 80
Sud, 2, 60
Sud, 3, 110
Sud, 4, 70
];

// Measures to add (first and second diagrams):
//   Above(Sum(Sales))                             → NULL at the top of each region
//   Above(TOTAL Sum(Sales))                       → month 1 of Sud reads month 4 of Nord (150)
//   Sum(Sales) - Above(Sum(Sales))                → Nord: –, 20, -30, 60
//   RangeSum(Above(Sum(Sales), 0, RowNo()))       → Nord: 100, 220, 310, 460
//   RangeAvg(Above(Sum(Sales), 0, 3))             → Nord: 100, 110, 103.3, 120
//   Sum(Sales) / Top(Sum(Sales))                  → index base 1 at month 1 of each region
//
// Then exclude Month = 2: month 3's variance is now computed against month 1.
Sources
- Qlik Cloud help: Inter-record functions in charts, overview and sorting restriction.
- Qlik Cloud help: Above, column segments, ranges and running-total examples.
- Qlik Cloud help: Modifiers, accumulation, moving average, difference and relative numbers.
Text and examples are by HeyData. This article is part of our series on lesser-known Qlik Sense functions and keywords: explore the series.