
· By HeyData team
Series: Lesser-known Qlik Sense functions and keywords: a series · article 5 of 13
Window() in Qlik Sense: averages, running totals and sliding windows in the script
Getting a group average without losing the detail, a three-month moving average or a running total per customer: in SQL, these are window functions (OVER (PARTITION BY … ORDER BY …)). In the Qlik script they long required a detour, GROUP BY then a join, or ORDER BY then Peek(). The Window() function does the job in one line.
This article is part of our series on lesser-known Qlik Sense functions and keywords. It is based on the Qlik help; links are at the end of the article.
GROUP BY reduces, Window keeps
A LOAD … GROUP BY Region returns one row per region: the detail is gone. Window() computes the same aggregation but returns it on every row. The number of rows does not change.
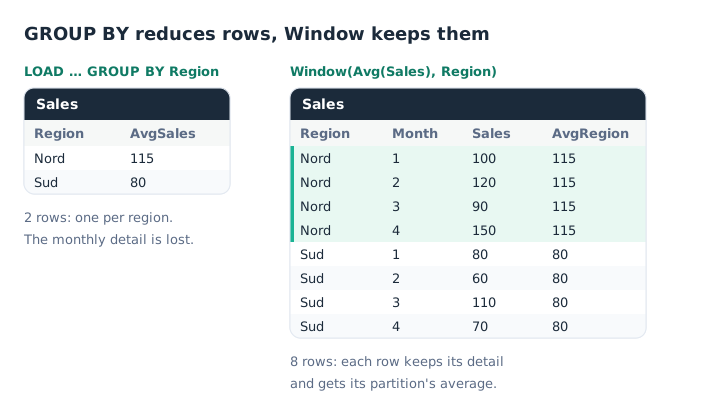
Same average, but Window keeps all eight rows.
Sales:
LOAD *,
     Window(Avg(Sales), Region) as AvgRegion
INLINE [
Region, Month, Sales
Nord, 1, 100
Nord, 2, 120
Sud, 1, 80
Sud, 2, 60
];
The syntax
Window(main_expr [, partition1, partition2, …] [, sort_type, sort_expr] [, filter_expr] [, start_expr, end_expr])main_expr: the aggregation to compute, for exampleAvg(Sales). A bare field is treated asOnly(field). It cannot contain another aggregation or anotherWindow().- The partitions: the fields that split the table into groups. Without a partition, the whole table is one group.
sort_type:'ASC','DESC'or'NONE'. The first two require a sort expressionsort_expr; the third takes none.filter_expr: a condition. Rows that fail it are left out of the calculation but still receive a result. The filter needs asort_type,'NONE'if order does not matter.start_expr, end_expr: the bounds of a sliding window, in rows relative to the current row. They always come as a pair and require a sort.
Sorting is set in the function itself: there is no need for an ORDER BY on the LOAD.
Sliding window and running total
With a sort and two bounds, the window follows the current row. -2, 0 takes the two previous rows and the current row: a three-month moving average. Unbounded() replaces a bound with “every row up to the edge of the partition”: with Unbounded(), 0, you get a running total.
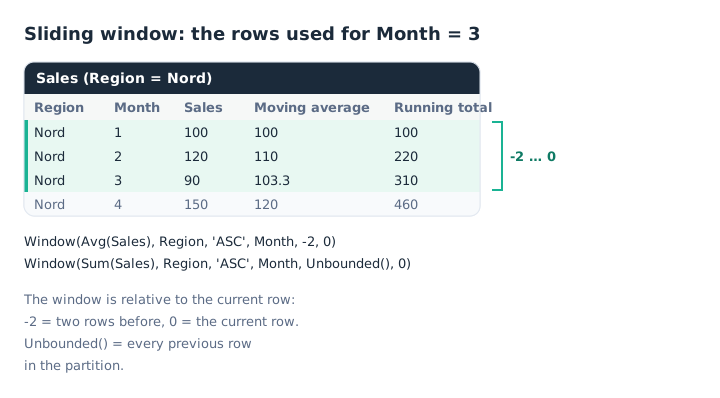
The moving average for month 3 covers months 1 to 3.
Sales:
LOAD *,
     Window(Avg(Sales), Region, 'ASC', Month, -2, 0)          as MovingAvg3,
     Window(Sum(Sales), Region, 'ASC', Month, Unbounded(), 0) as RunningTotal
INLINE [
Region, Month, Sales
Nord, 1, 100
Nord, 2, 120
Nord, 3, 90
Nord, 4, 150
];
At the start of the partition the window is simply shorter: the moving average for month 1 covers month 1 only. If you want an empty result until the window is full, test the row count with Window(Count(Sales), Region, 'ASC', Month, -2, 0) = 3.
Sorting matters. A month stored as text, such as 2026-W01 or Jan 2026, sorts alphabetically. The Qlik Community regularly reports skewed windows for this reason: sort on a number, a date or a period number.
Filtering without losing rows
The filter takes rows out of the calculation without removing them from the table:
Window(Avg(Sales), Region, 'NONE', Month >= 2) as AvgFromMonth2For Nord, the average covers months 2 to 4 (120, 90 and 150, so 120). Month 1 still receives that value. This is useful to compare each row with a reference computed on part of the data only.
Before Window: the classic way
The same average per region used to take an aggregation then a join:
Left Join (Sales)
LOAD Region, Avg(Sales) as AvgRegion
RESIDENT Sales
GROUP BY Region;
For a sliding window or a running total, you sorted with ORDER BY and walked back with Peek(), as in our article on generating missing data. These methods are still valid, and often cheaper: Window() is not free.
Limitations
The Qlik help lists them clearly:
- A high cost. Compared with an equivalent operation (
WHERE,GROUP BY,ORDER BY), aWindow()function typically needs two to four times more memory and reload time. With a sliding window, time grows with the window size. - Script only.
Window()does not exist in chart expressions. In visualizations, inter-record functions (Above(),RangeSum()…) andAggr()play that role. - No combining. No
GROUP BYin the sameLOAD, no nesting inside an aggregation or anotherWindow(). - Excluded functions.
RecNo(),RowNo()andWRank()cannot be used with a sliding window. - The whole table. The function must be able to scan the whole table, and it is not supported in Qlik Sense Mobile.
As for versions, Window() arrived in Qlik Sense Enterprise on Windows in November 2023. In that release it had to be enabled in the engine’s Settings.ini file (EnableWindowScriptFunction=1). Check your version’s documentation before using it client-managed. It is available in Qlik Cloud.
Key takeaways
- One value per row. Window computes per partition without reducing the table, unlike
GROUP BY. - Sorting lives in the function.
'ASC'or'DESC'with a sort expression,'NONE'otherwise: noORDER BYto add. - Two bounds to slide.
-2, 0for a moving average,Unbounded(), 0for a running total. - A filter that removes nothing. Filtered rows leave the calculation, not the table.
- Sort on a number. A month stored as text skews the window order.
- Measure the cost. Two to four times more memory and time: on a large table, compare with
GROUP BYorPeek().
Try it in Qlik Sense
This script replays the article’s examples with the data from the diagrams, loaded INLINE: it needs no file and no database. Paste it into the data load editor of an empty app, pick an example with the vExample variable, then reload.
// Window() in Qlik Sense: try-it script (HeyData)
// Paste it into the data load editor of an empty app, pick an example,
// reload, then preview the table in the data model viewer.
SET vExample = 1;   // 1 to 3

Sales:
LOAD * INLINE [
Region, Month, Sales
Nord, 1, 100
Nord, 2, 120
Nord, 3, 90
Nord, 4, 150
Sud, 1, 80
Sud, 2, 60
Sud, 3, 110
Sud, 4, 70
];

IF $(vExample) = 1 THEN
    // Example 1: the average per region, on every row (first diagram)
    Result:
    NoConcatenate
    LOAD *,
         Window(Avg(Sales), Region) as AvgRegion
    RESIDENT Sales;
    // 8 rows; AvgRegion is 115 for Nord and 80 for Sud.
END IF

IF $(vExample) = 2 THEN
    // Example 2: 3-month moving average and running total (second diagram)
    Result:
    NoConcatenate
    LOAD *,
         Window(Avg(Sales), Region, 'ASC', Month, -2, 0)          as MovingAvg3,
         Window(Sum(Sales), Region, 'ASC', Month, Unbounded(), 0) as RunningTotal
    RESIDENT Sales;
    // Nord: MovingAvg3 = 100, 110, 103.3, 120; RunningTotal = 100, 220, 310, 460.
END IF

IF $(vExample) = 3 THEN
    // Example 3: a filtered average, and the classic way for comparison
    Result:
    NoConcatenate
    LOAD *,
         Window(Avg(Sales), Region, 'NONE', Month >= 2) as AvgFromMonth2
    RESIDENT Sales;

    Left Join (Result)
    LOAD Region, Avg(Sales) as AvgRegionGroupBy
    RESIDENT Sales
    GROUP BY Region;
    // AvgFromMonth2: 120 for Nord, 80 for Sud, including on the month 1 row.
END IF

DROP TABLE Sales;
Sources
- Qlik Cloud help: Window - script function, syntax, examples and limitations.
- Qlik Community, Design Blog: Peeking through the Window Script Function.
- Qlik Community: Data window functions in engine, enabling it on Qlik Sense Enterprise on Windows.
Text and examples are by HeyData. This article is part of our series on lesser-known Qlik Sense functions and keywords: explore the series.