
· By HeyData team
Series: Lesser-known Qlik Sense functions and keywords: a series · article 2 of 13
Advanced set analysis in Qlik Sense: P(), E(), operators and searches
Sum({<Year = {2026}>} Sales): most Qlik developers write this kind of expression every day. Yet set analysis goes much further. It can answer “sales of customers who have ever bought a given product”, “customers who never bought it” or “customers whose total exceeds a threshold”, without a single line of script. These capabilities remain underused, and one pitfall keeps coming up in the Qlik Community.
This article is part of our series on lesser-known Qlik Sense functions and keywords. It is based on the Qlik help and the Qlik Community; links are at the end of the article.
Reminder: identifier, modifier, operators
A set expression is made of an identifier and a modifier:
- the identifier designates a set of records:
$for the current selection (the default),1for all records,$1for the previous selection, a bookmark, or the name of an alternate state; - the modifier, in angle brackets, changes the selection of some fields:
<Year = {2026}>, or<Region = >to clear the selection onRegion.
Identifiers combine with four operators: + (union), - (exclusion), * (intersection) and / (symmetric difference). {1 - $} thus designates the records excluded by the current selection.
P() and E(): values linked to another set
P() returns the possible values of a field in a set, E() its excluded values. Placed in a modifier, they select one field based on what happens in another.
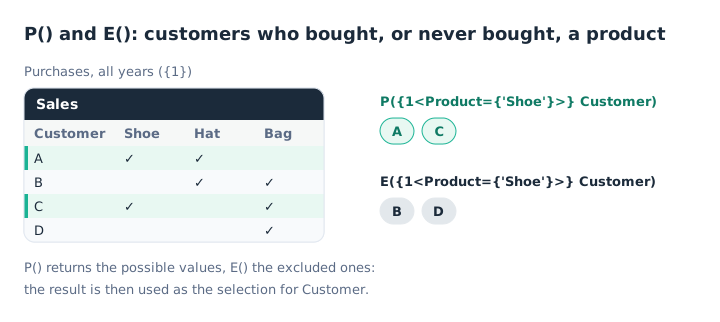
P() keeps the customers who bought Shoe, E() the others.
// Sales of customers who have ever bought Shoe, all products
Sum({<Customer = P({1<Product = {'Shoe'}>} Customer)>} Amount)

// Sales of customers who never bought Shoe
Sum({<Customer = E({1<Product = {'Shoe'}>} Customer)>} Amount)
The inner 1 matters: it looks for Shoe buyers across the whole history, whatever the selection. If the user selects 2026, the measure gives the 2026 sales of customers who bought Shoe at some point, even in 2025. The Qlik help notes that only “natural” sets, those a selection can describe, work reliably inside P() and E(): avoid {1-$} there.
Combining value lists
The four operators also apply to a modifier’s value lists:
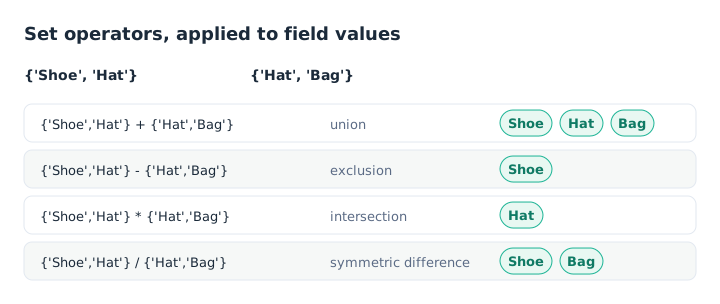
Union, exclusion, intersection and symmetric difference.
Sum({<Product = {'Shoe', 'Hat'} - {'Hat'}>} Amount)                 // Shoe only
Sum({<Customer = P({1<Product = {'Shoe'}>}) * P({1<Product = {'Bag'}>})>} Amount)   // bought Shoe AND Bag
A - on its own gives the complement: <Product = -{'Bag'}> selects every product except Bag.
Assigning relative to the selection: +=, -=, *=, /=
The = sign replaces the field’s selection. Its variants modify it:
<Year += {2026}>adds 2026 to the current selection;<Region -= {'North'}>removes North from the selection;<Region *= {'North', 'South'}>keeps the intersection of the selection and the list.
With 2025 selected, Sum({<Year += {2026}>} Amount) covers 2025 and 2026, whereas Sum({<Year = {2026}>} Amount) covers 2026 only.
Searches in a modifier
In double quotes, a value becomes a search:
- wildcards:
{"Sh*"}or{"?at"}; - numeric or date ranges:
{">=2025<=2026"}, the format having to match the field’s; - expression search:
{"=Sum(Amount) >= 100"}keeps each field value for which the condition is true.
// Sales of customers whose total reaches 100
Sum({<Customer = {"=Sum(Amount) >= 100"}>} Amount)
The inner sum follows the current selection; for a threshold computed over the whole history, write {"=Sum({1} Amount) >= 100"}. Single quotes designate an exact, case-sensitive value; double quotes perform a case-insensitive search.
The pitfall: one set per chart, not per row
A set expression is evaluated once for the whole chart, before the rows are computed. It therefore cannot depend on the dimension value of each row. In a table by year, this measure does not give “the previous year’s sales”:
Sum({<Year = {$(=Max(Year) - 1)}>} Amount)Max(Year) is computed once, on the selection: every row gets the same year filter, and only that year’s row shows a value. For a row-by-row comparison, use inter-record functions such as Above(), or prepare a field in the script. The Qlik Community points this out in many threads, including the one cited in the sources.
Key takeaways
- P() and E() link two fields. “Customers who bought X”, “those who never did”.
- The inner 1 ignores the selection. To search the whole history, whatever the selection.
- Operators on values.
+,-,*and/also combine value lists. - += and -= modify the selection. The
=sign replaces it. - Expression searches.
{"=Sum(Amount) >= 100"}filters a field’s values by a calculation. - One set per chart. Set analysis never depends on the row: for that, Above() or the script.
Try it in Qlik Sense
This script replays the article’s examples with the data from the diagrams, loaded INLINE: it needs no file and no database. Paste it into the data load editor of an empty app and reload. The expressions to try are in comments.
// Advanced set analysis in Qlik Sense: try-it script (HeyData)
// Paste it into the data load editor of an empty app, reload,
// then try the expressions below in KPIs or a table.
Sales:
LOAD * INLINE [
Customer, Product, Year, Amount
A, Shoe, 2025, 100
A, Hat, 2026, 50
B, Hat, 2025, 70
B, Bag, 2026, 30
C, Shoe, 2026, 200
C, Bag, 2025, 40
D, Bag, 2026, 60
];

// No selection:
//   Sum(Amount)                                                         → 550
//   Sum({<Customer = P({1<Product = {'Shoe'}>} Customer)>} Amount)       → 390 (A and C, first diagram)
//   Sum({<Customer = E({1<Product = {'Shoe'}>} Customer)>} Amount)       → 160 (B and D)
//   Sum({<Product = {'Shoe', 'Hat'} - {'Hat'}>} Amount)                 → 300 (second diagram)
//   Sum({<Customer = P({1<Product = {'Shoe'}>}) * P({1<Product = {'Bag'}>})>} Amount)   → 240 (C)
//   Sum({<Customer = {"=Sum(Amount) >= 100"}>} Amount)                  → 490 (A, B and C)
//
// Select Year = 2026:
//   Sum({<Customer = P({1<Product = {'Shoe'}>} Customer)>} Amount)       → 250 (2026 sales of A and C)
//
// Select Year = 2025:
//   Sum({<Year += {2026}>} Amount)                                      → 550 (2025 and 2026)
//   Sum({<Year = {2026}>} Amount)                                       → 340 (2026 only)
//
// The pitfall: table by Year, no selection
//   Sum({<Year = {$(=Max(Year) - 1)}>} Amount)   → 210 on the 2025 row; 0 on 2026 (row hidden if zeros are)
Sources
- Qlik Cloud help: Set expressions, identifiers and operators.
- Qlik Cloud help: P() and E() functions, operators in modifiers, implicit assignments and searches.
- Qlik Community: A set analysis is calculated once per chart/table….
Text and examples are by HeyData. This article is part of our series on lesser-known Qlik Sense functions and keywords: explore the series.