
· By HeyData team
Series: Lesser-known Qlik Sense functions and keywords: a series · article 12 of 13
ValueLoop and ValueList: synthetic dimensions in Qlik Sense
A dashboard sometimes needs a dimension that exists in no table: KPIs shown as rows (“Orders”, “Average order”, “Revenue”), or a scale of discount rates for a simulation. The reflex is to add a small table to the model. Qlik Sense offers something lighter: two functions, ValueList() and ValueLoop(), produce these values directly in the chart. The Qlik help calls them synthetic dimensions.
This article is part of our series on lesser-known Qlik Sense functions and keywords. It is based on the Qlik help; links are at the end of the article.
Two functions, two ways to produce values
ValueList('Orders', 'Average order', 'Revenue')   // the listed values
ValueLoop(0, 20, 5)                               // 0, 5, 10, 15, 20
ValueList(v1, v2, …)returns the listed values, most often text.ValueLoop(from, to, step)returns a sequence of numbers, fromfromtotoin increments ofstep, 1 by default.
Used as a calculated dimension, each creates one row per value. Two rules from the help frame their use:
- a synthetic dimension ignores selections: all its values are always shown;
- to know the row’s value in a measure, you repeat the call, with exactly the same parameters.
ValueList(): KPIs as rows
The second rule gives the recipe for a KPI table: the dimension lists the labels, the measure recognizes the row’s label and picks the matching calculation.
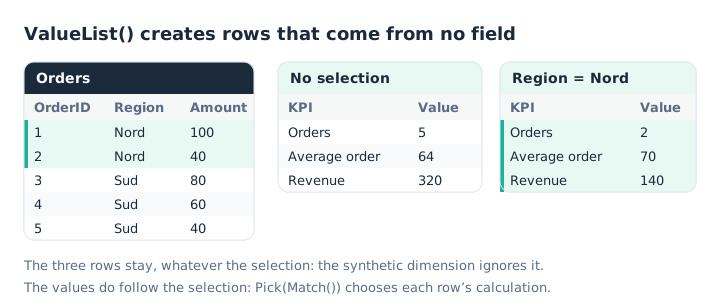
The rows stay put; the values follow the selection.
To avoid rewriting the list each time, and to keep a typo from breaking the match, put it in a variable:
SET vKPIs = ValueList('Orders', 'Average order', 'Revenue');The dimension is then written =$(vKPIs), and the measure:
Pick(Match($(vKPIs), 'Orders', 'Average order', 'Revenue'),
     Count(OrderID),
     Avg(Amount),
     Sum(Amount))
Match() returns the label’s position in the list, and Pick() the calculation at that position: our article on Class, Match and Pick details this pair. The commas inside the variable cause no trouble: they only get in the way of variables called with parameters, as our article on dollar-sign expansion explains.
ValueLoop(): a simulation without a table
ValueLoop() produces a scale of numbers. Combined with a measure that repeats it, it gives a simulation: revenue for each discount rate.
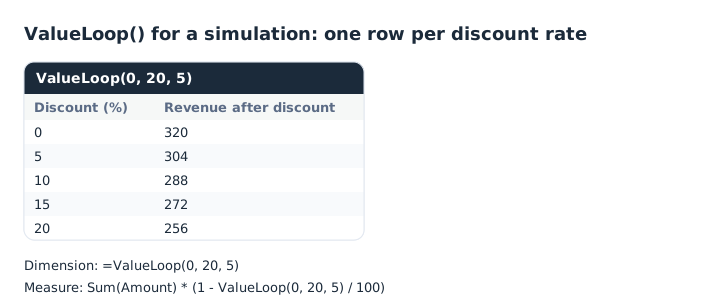
The discount value is read back in the measure by a second call to ValueLoop().
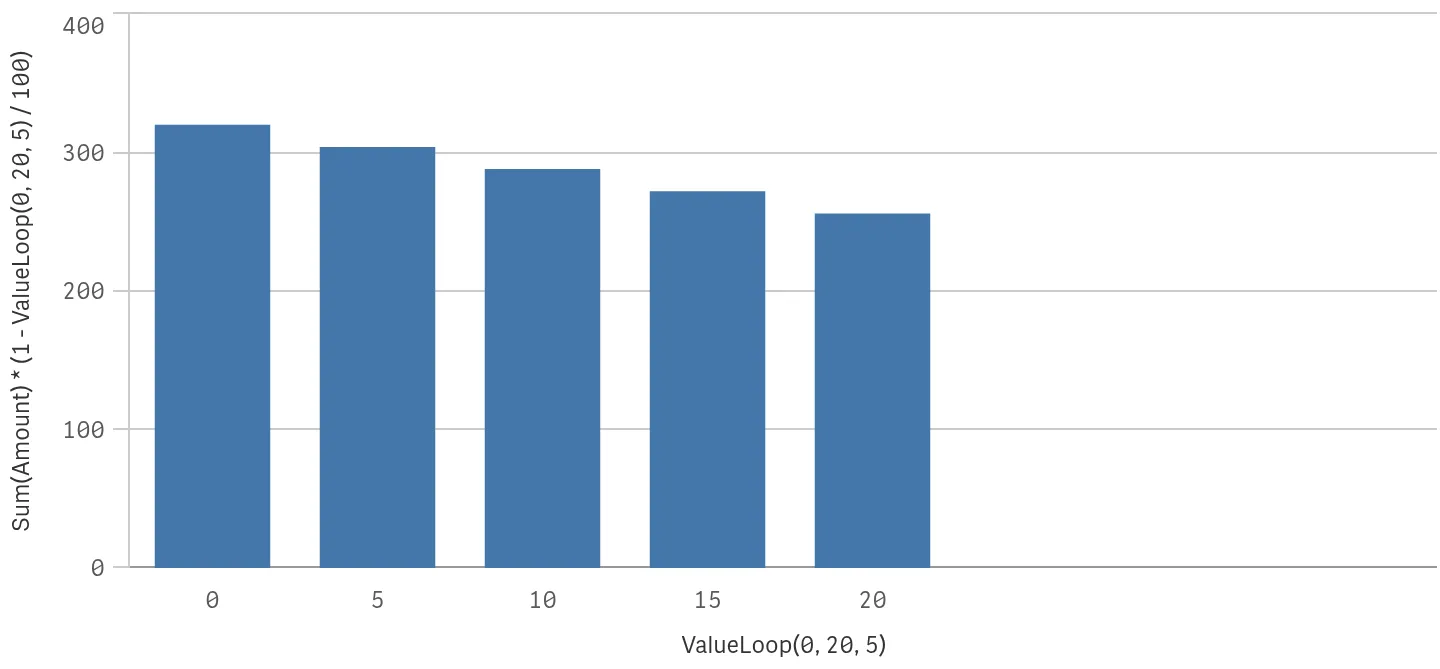
In Qlik Cloud: the same simulation as a chart, with no discount table in the model.
The same principle serves to number rows, or to draw a sensitivity curve: the axis comes from ValueLoop(), the curve from the measure.
When to prefer a table
Synthetic dimensions add nothing to the data model, and that is their strength. They also have their limits:
- Nothing to select. The values come from no field: you cannot filter on “Average order” elsewhere in the app.
- One list per chart. Each object repeats the call; a variable limits the risk, but the list stays scattered.
- A growing measure. Beyond a few KPIs, the
Pick()becomes hard to read.
When the list must act as a filter, or be shared across several sheets, a small table loaded in the script, unlinked to the other tables, remains the right solution.
Key takeaways
- A dimension without a field. ValueList() lists values, ValueLoop() generates a sequence of numbers.
- Unaffected by selections. All values stay shown; the measures do follow the selection.
- Repeat the call to read the value. In the measure, with exactly the same parameters.
- A variable for the list.
$(vKPIs)in both the dimension and the measure guarantees the match. - Pick(Match()) to choose the calculation. One calculation per label, in list order.
- A table when you need to filter. A synthetic dimension cannot be selected.
Try it in Qlik Sense
This script loads the diagrams’ data INLINE and creates the two variables. Paste it into the data load editor of an empty app and reload. Then build the two tables described in the comments.
// ValueLoop and ValueList in Qlik Sense: try-it script (HeyData)
// Paste it into the data load editor of an empty app, reload,
// then build the tables described in the comments.
Orders:
LOAD * INLINE [
OrderID, Region, Amount
1, Nord, 100
2, Nord, 40
3, Sud, 80
4, Sud, 60
5, Sud, 40
];

SET vKPIs = ValueList('Orders', 'Average order', 'Revenue');
SET vDiscounts = ValueLoop(0, 20, 5);

// Table 1 (first diagram)
//   Dimension: =$(vKPIs)
//   Measure:   =Pick(Match($(vKPIs), 'Orders', 'Average order', 'Revenue'),
//                    Count(OrderID), Avg(Amount), Sum(Amount))
//   No selection: 5, 64, 320; with Region = Nord: 2, 70, 140
//
// Table 2 (second diagram)
//   Dimension: =$(vDiscounts)
//   Measure:   =Sum(Amount) * (1 - $(vDiscounts) / 100)
//   Result:    320, 304, 288, 272, 256
Sources
- Qlik Cloud help: Synthetic dimension functions, principle and insensitivity to selections.
- Qlik Cloud help: ValueList and ValueLoop, syntax and reading the value back in a measure.
Text and examples are by HeyData. This article is part of our series on lesser-known Qlik Sense functions and keywords: explore the series.